Building attribute data is a form of property data that records building characteristics as structured fields in a table rather than as images. A national building footprint layer connects each building outline to its corresponding land parcel and street address. MetroMap sources this data through its partner, Geoscape Australia. Each MetroMap building record includes the first and most recent capture dates, while solar and pool attributes have separate capture dates, allowing users to assess the currency of each field.
| Building attribute data | Reading current aerial imagery | Site visit | |
|---|---|---|---|
| What it gives | Fields per building: heights, roof type, pool, solar, land parcel information | A dated picture of the roof and yard | What a person sees on the day, inside and out |
| How it is read | Fields shown for each building or lot clicked on the map | One property at a time, by eye | One property per trip |
| How current | Geoscape provide first and last capture dates for their provided attributes, such as pools and solar. | MetroMap typically captures most areas in our coverage area between 1-6 times a year. | The day of the visit |
| When a site visit is better | Does not cover inside a building or roof condition | Shows only what can be seen from above | Covers condition, inside spaces and anything changed since the last capture |
For insurance and risk teams, two Geoscape layers support preliminary property assessments before site inspections. Property Boundary (Cadastre) and Details identifies land parcels and their addresses, while Building Footprint Insights includes roof height, slope and material, tree overhang, estimated floors, pools and solar installations, with associated capture dates. Although these datasets cannot establish roof condition or internal building characteristics, they help identify properties requiring site inspections.
Property Boundary (Cadastre) and Details is included in Pro and Team plans, while Building Footprint Insights is available as an add-on. Both datasets are optional under Enterprise plans.
Property risk teams use building attribute data that records a building’s size, roof, site and features. MetroMap supplies these fields through our partner Geoscape Australia, with the building fields in the Geoscape building footprint layer and the parcel fields in the cadastre layer.
This data provides users with a more complete view of a site, allowing stakeholders to answer common questions:
| Question | Fields in the footprint layer |
|---|---|
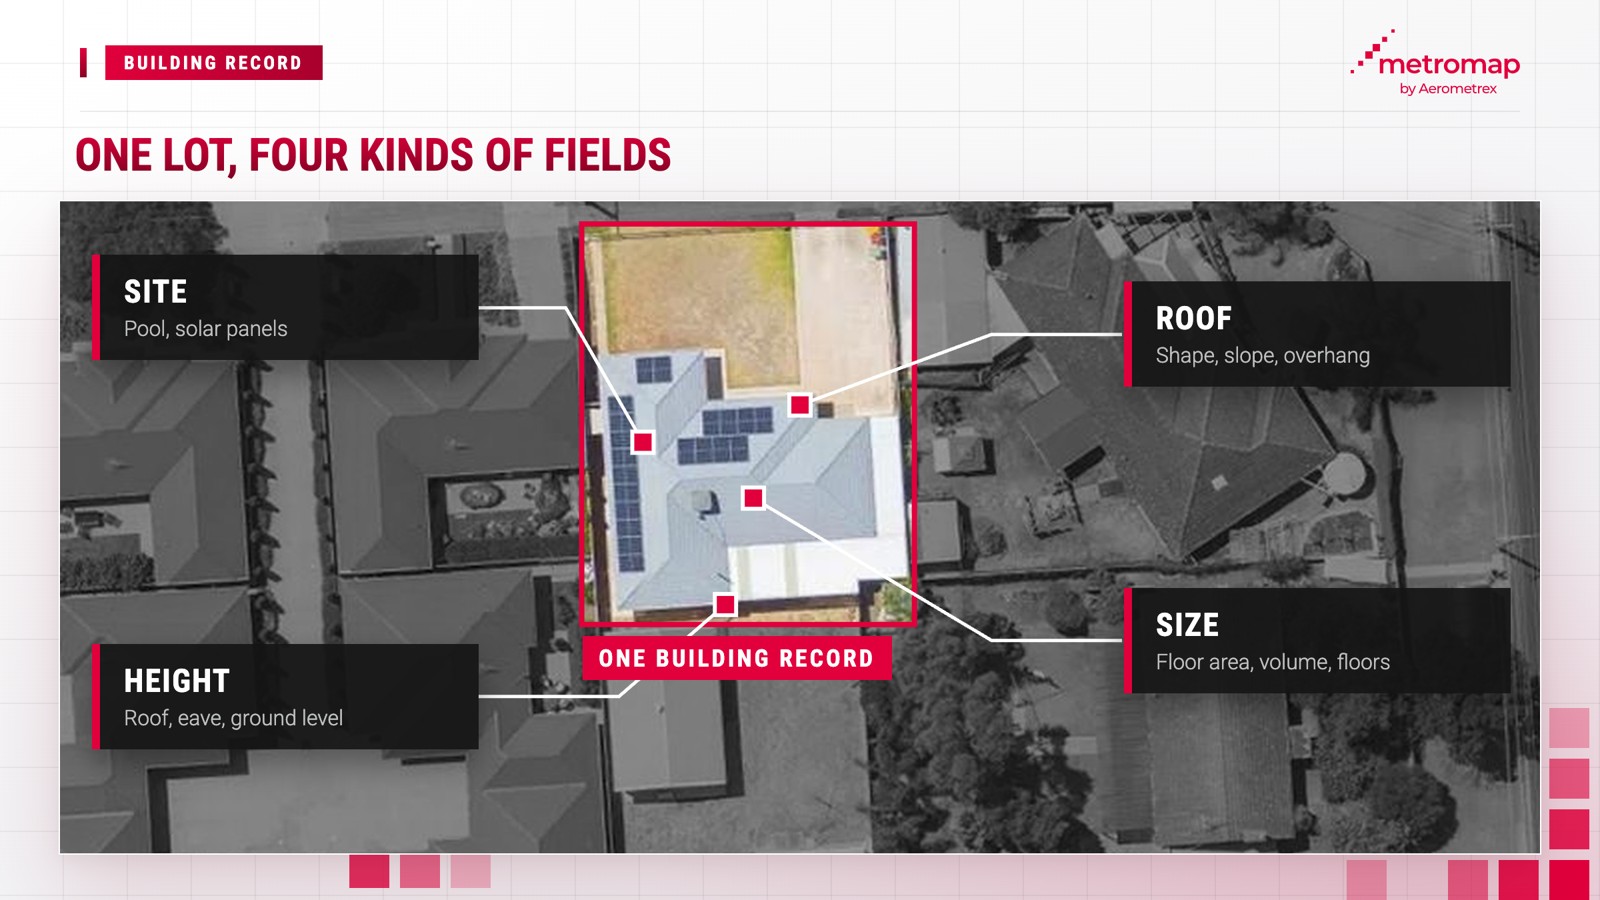
| How big is the building? | Building area, total floor area, building volume, estimated floors |
| How tall is it? | Roof height, eave height, ground elevation |
| What is the roof like? | Roof shape, roof slope, roof colour, primary roof material, tree overhang |
| What else is on the site? | Pool flag, pool count, pool area, solar flag, solar area, daily estimated power |
Rooftop solar is widespread across Australian households. In 2024, the Clean Energy Regulator reported that 1 in 3 suitable Australian homes had rooftop solar installations, making solar attributes relevant to a substantial proportion of residential property assessments.
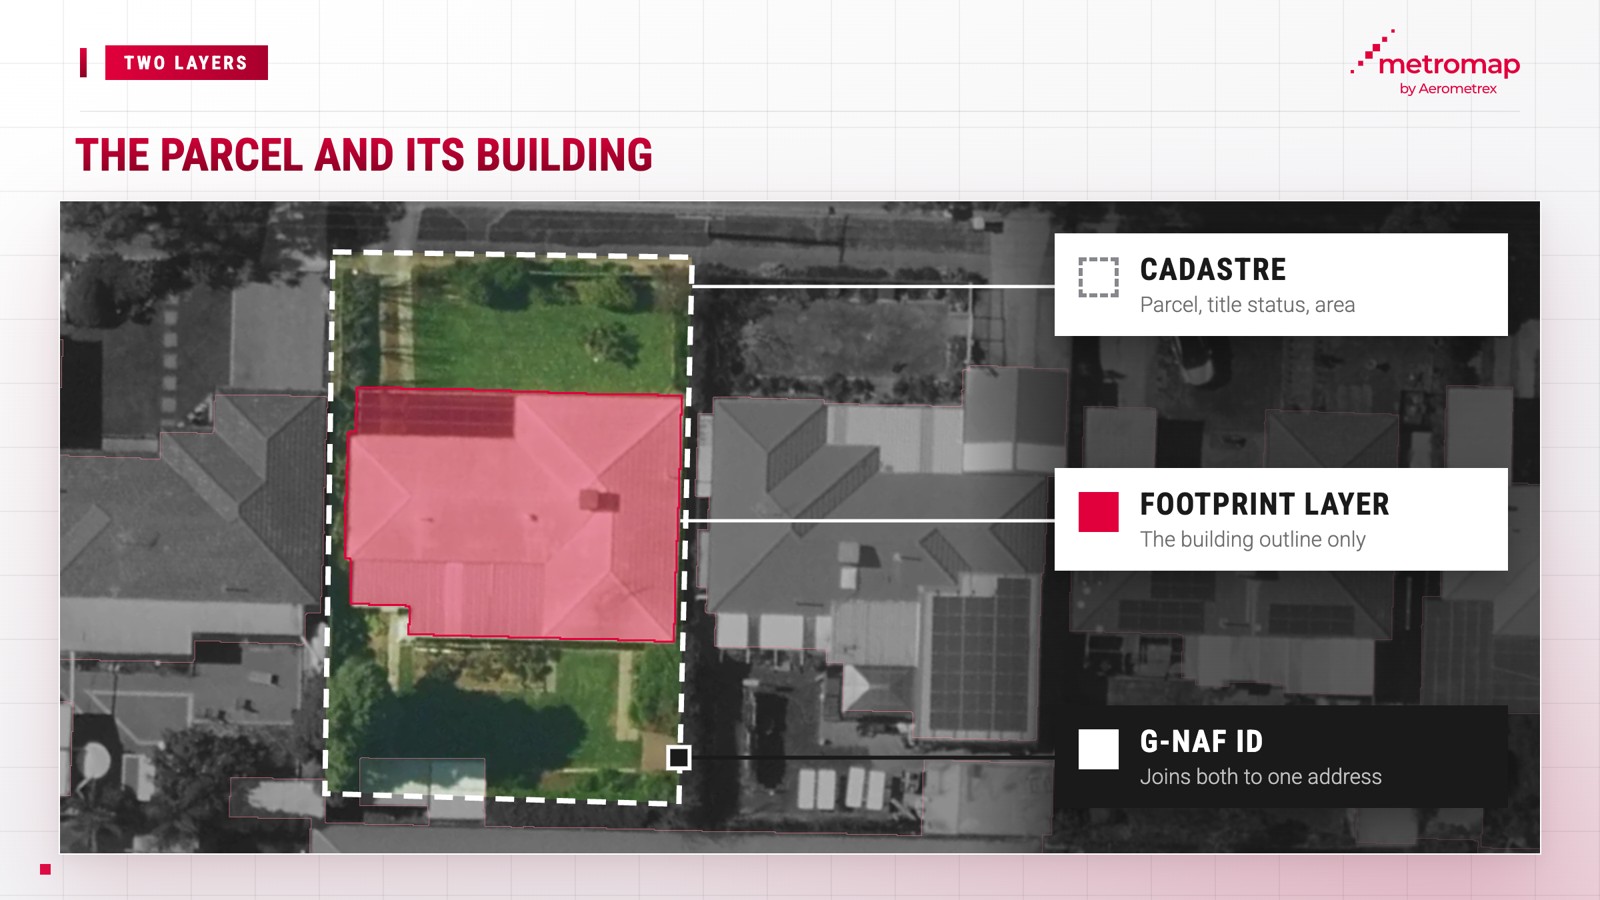
A building footprint layer contains the outline of each building, plus a record of facts about it. The Geoscape building footprint layer in MetroMap holds fields for the building’s location, use, size, height, roof, solar panels and pools. Each record contains its first and most recent capture dates, capture resolution and capture method. Solar and pool attributes also have separate capture dates, resolutions and methods.
MetroMap organises these attributes into eight categories, covering building location, characteristics, capture information and record updates.
Each building record also includes a mesh block code and a Statistical Area Level 1 (SA1) code, both defined by the Australian Bureau of Statistics (ABS). The ABS identifies Mesh Blocks as “the smallest geographic areas defined by the ABS”. SA1 areas consist of whole Mesh Blocks and are designed to maximise geographic detail in Census data. These codes allow MetroMap users to group buildings geographically and link them to ABS statistics for corresponding areas.
MetroMap Insights is a separate product that identifies buildings, pools, solar panels, trees, driveways and grass within MetroMap's aerial imagery. It enables businesses, including pool cleaning services and solar installers, to identify potential customers.
A cadastre layer records legal land parcels and their associated attributes. The NSW Government defines a land parcel as "an area of land with defined boundaries, managed under specific property rights or interests", with a cadastre representing the complete collection of these parcels. MetroMap's Geoscape cadastre includes each parcel's address, council area, title status, type, area, identifiers, centre point and record dates, allowing users to link buildings to their corresponding land parcels.
MetroMap organises cadastre attributes into five categories based on the information recorded for each land parcel.
The address ID connects each parcel to G-NAF, Australia's national address database, which contains 15.9 million addresses according to the data.gov.au G-NAF listing. As each MetroMap parcel record includes a G-NAF ID, users can match parcel addresses against their organisation's existing address records.
The cadastre defines land parcel boundaries, while the building footprint layer identifies the structures within them. Together, these layers indicate the proportion of each parcel occupied by buildings.
Yes, MetroMap shows structured building attribute data from the Geoscape layers right next to its aerial imagery. The building fields (such as roof, roof material, height, pool and solar) sit in the Geoscape building footprint layer, and the parcel fields sit in the cadastre layer.
Layer availability depends on the selected MetroMap plan. All prices listed below are inclusive of GST.
| Plan | Price | Cadastre and details | Building footprint insights |
|---|---|---|---|
| Pro (1 named user) | $2,640 a year (paid annually) | Included | Add-on |
| Team (up to 5 named users) | $6,999 a year (paid annually) | Included | Add-on |
| Enterprise (custom users) | By quote | Optional | Optional |
Analysts can review building attribute data and examine recent imagery of the same roof within MetroMap. This access to reliable location intelligence supports informed business decisions by insurers.
Building attribute data cannot establish roof condition or reveal a building's interior. MetroMap's Geoscape fields record building size, height, roof type and features but do not assess their condition. As these fields are derived from imagery captured from above on specific dates, features concealed beneath roofs or added after the capture date may not be recorded. This creates four limitations:
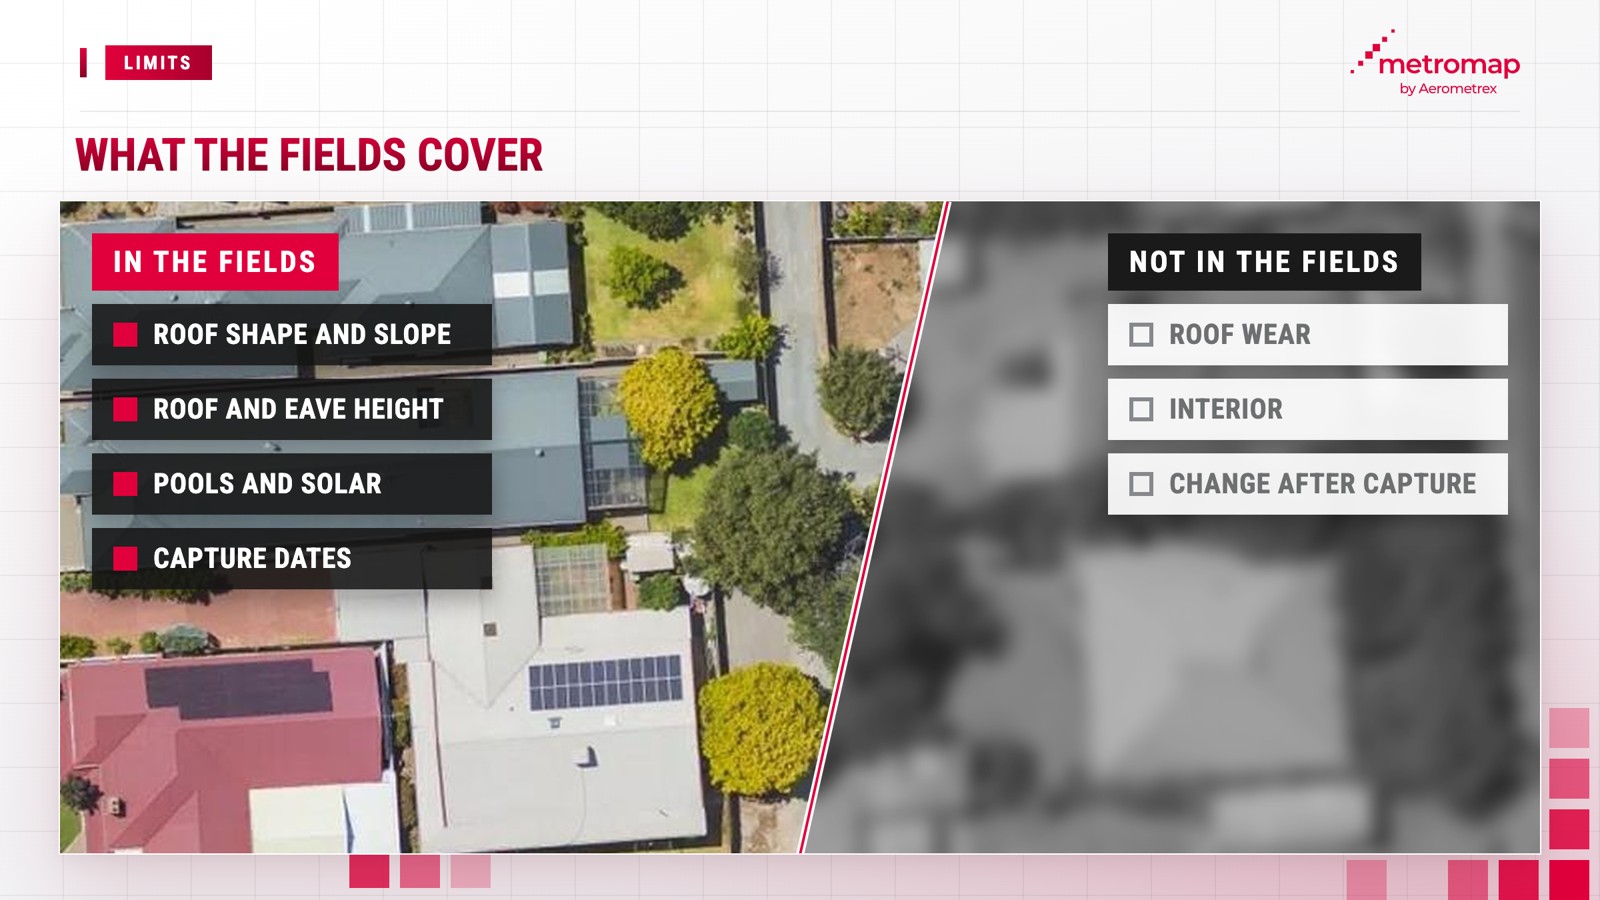
MetroMap's capture dates help address the third limitation, as each record identifies when the building was first and most recently captured. Analysts can use these dates to determine whether a field predates a known change to the property.
Combining Geoscape and MetroMap data offers users a more comprehensive view of a property. Teams can compare data layers with current aerial imagery before determining whether a site inspection is necessary.
No. The cadastre holds land parcels, their addresses and their title status, while the footprint layer holds the buildings that stand on them. MetroMap supplies both through our partner Geoscape Australia.
No. The layer records roof shape, slope, colour, material and tree overhang, but it does not rate wear or damage. Teams can check Geoscape data against MetroMap imagery to spot what’s changed, such as a new pool or solar panels that aren’t in the building record yet.
Geoscape Cadastre is included in Pro and Team and optional on Enterprise. Building footprint insights are an add-on for Pro and Team and optional on Enterprise.
No. MetroMap Insights highlights features such as pools and solar panels in MetroMap's own imagery. The footprint layer is Geoscape data stored as fields for each building.
View the world from our eyes ! Here we share some exciting images from across MetroMap