MetroMap aerial imagery has a typical horizontal positional error of approximately 21 to 30 cm on the ground, providing sufficient accuracy for preliminary engineering and planning assessments but not for establishing legal property boundaries, which require a registered surveyor. Aerial imagery accuracy refers to how closely features depicted in an image correspond to their actual ground positions. MetroMap reports a positional error of 3 pixels, with each pixel representing 7 to 10 cm on the ground, known as the Ground Sample Distance (GSD).
| Aerial imagery | Free public satellite data | Registered ground survey | |
|---|---|---|---|
| Ground detail | 7 to 10 cm pixels | 10 m to 60 m pixels | Point by point, on site |
| Typical error | 3 pixels, about 21 to 30 cm | Set by a much larger pixel | Set by state survey rules |
| Good fit | Site layouts, early design checks, change between dates | Land cover and change across a region | Locating or defining a title boundary |
| Time to an answer | From the desk, no site visit | From the desk | A site visit by a surveyor |
| When a ground survey is better | A photo can show that a fence looks out of line, but cannot settle where the line is | Too coarse to judge a single lot | Any boundary, title or subdivision question |
Aerial imagery, free satellite data and a registered survey differ in pixel size, typical error, fit and time to an answer.
MetroMap imagery provides 3-pixel positional accuracy at 7 to 10 cm GSD, corresponding to a typical horizontal error of approximately 21 to 30 cm. Engineers and planners can assess whether this margin meets the accuracy requirements of individual projects. The imagery supports site layout assessments, preliminary design checks and monitoring changes over time, while establishing legal property boundaries requires an on-site survey by a registered surveyor. MetroMap enables initial site assessments to be conducted remotely, with formal surveys reserved for determining legally recognised boundaries.
MetroMap aerial imagery provides sufficient accuracy for preliminary engineering and planning assessments, provided its stated positional error falls within the project’s acceptable tolerance. Each pixel represents 7 to 10 cm on the ground (GSD), with horizontal positional accuracy of 3 pixels, corresponding to a typical displacement of approximately 21 to 30 cm from a point’s actual ground position. Vertical accuracy is assessed separately. The MetroMap elevation tool reports a typical vertical error of approximately 50 to 100 cm on hard surfaces for its surface model, which includes building rooftops and tree canopies, and approximately 100 cm for its bare ground model, which excludes these features.
Resolution and accuracy are distinct measures. Resolution refers to the ground distance represented by each pixel, with smaller centimetre-per-pixel values indicating greater image detail. Accuracy describes the distance between a point’s position in the image and its actual geographic location.
To convert 3-pixel positional accuracy into a ground distance, multiply the pixel count by the GSD:
MetroMap expresses its accuracy figures using Root Mean Square Error (RMSE), which represents a typical positional error rather than an absolute limit. Consequently, some points may fall closer to their actual locations, while others may exhibit greater deviations.
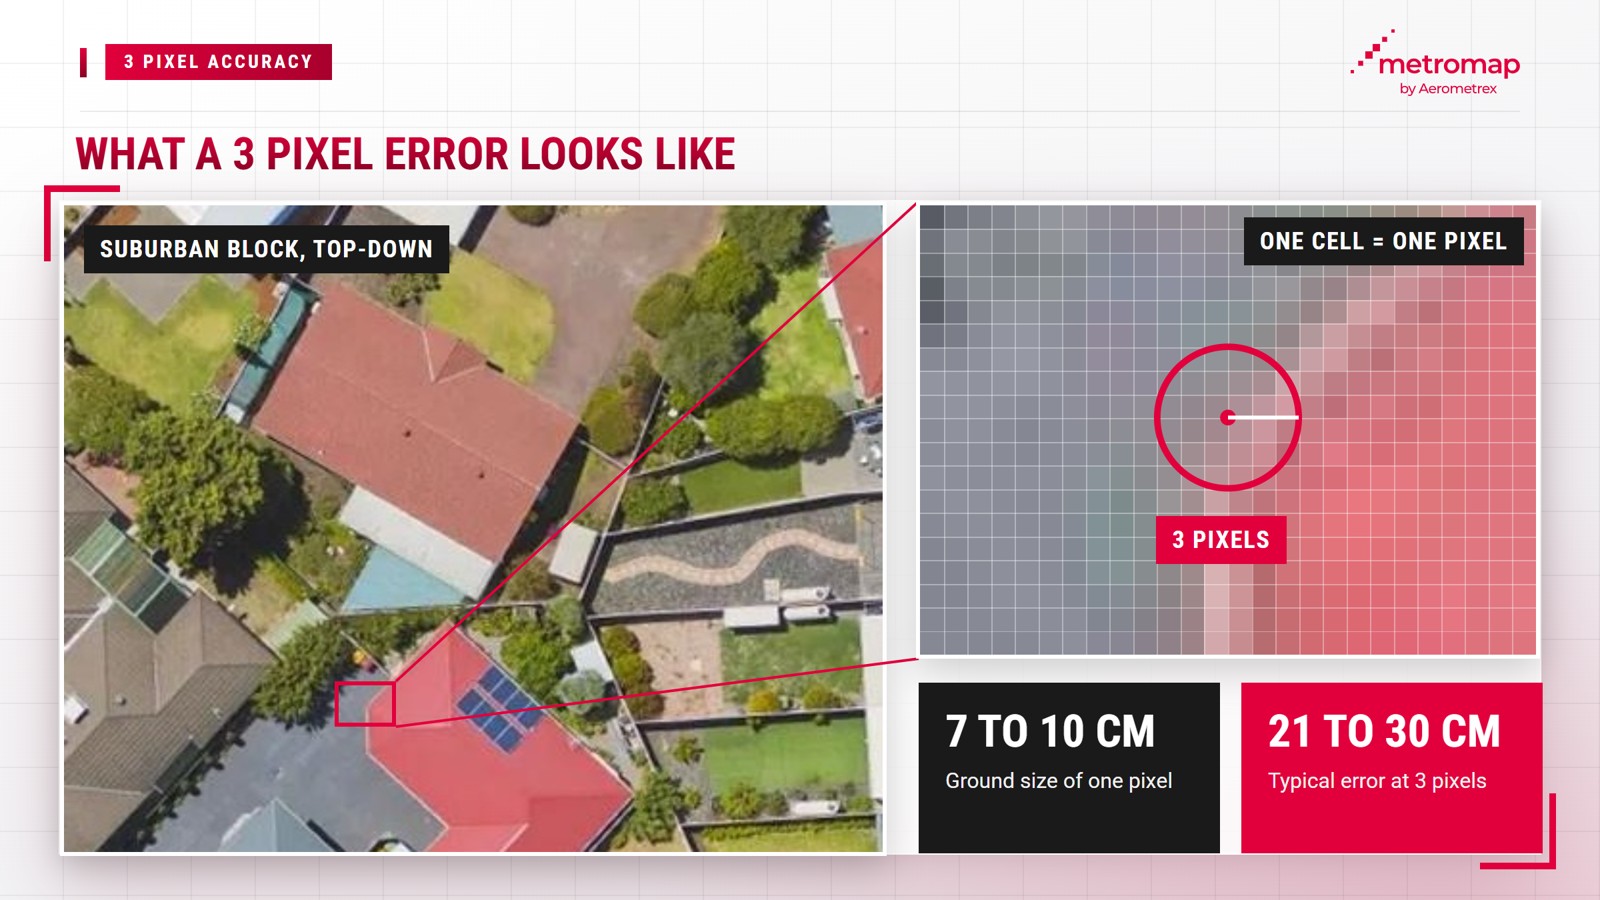
This margin of error is suitable for preliminary project stages. MetroMap supports engineering and construction teams in project planning, site layout assessments and progress monitoring, where understanding a site’s physical configuration and position is more relevant than establishing legally defined boundaries.
The imagery’s suitability for these applications is further reflected in the assessment of Richard Lemon, Spatial Section Manager at Jacobs, who states: "MetroMap imagery is best-in-market, offering recent, spatially accurate data that has great colour balance, minimal artefacts and details visible even in shadows."
Ground control points are locations on the ground with known, surveyed coordinates. Mapping teams use a subset of these points to align aerial imagery with a map, while reserving others to independently assess positional accuracy. MetroMap evaluates its 3-pixel accuracy against surveyed ground control points and standard map coordinate systems, which provide a consistent spatial reference for locating points on a map.
An aerial photograph captured from an aircraft does not automatically align with a map grid, as aircraft tilt and variations in terrain elevation introduce positional distortions. MetroMap corrects each image for aircraft tilt and ground elevation before it is used for measurements. The resulting geometrically corrected image is known as an orthophoto.
Independent check points provide a reliable basis for evaluating positional accuracy. The US Geological Survey’s standards for orthophotos require accuracy assessments using "independent ground check points of higher accuracy", referring to points surveyed with greater precision than the imagery and excluded from the alignment process. These standards report accuracy at a 95% confidence level, meaning approximately 95 out of every 100 check points fall within the specified distance.
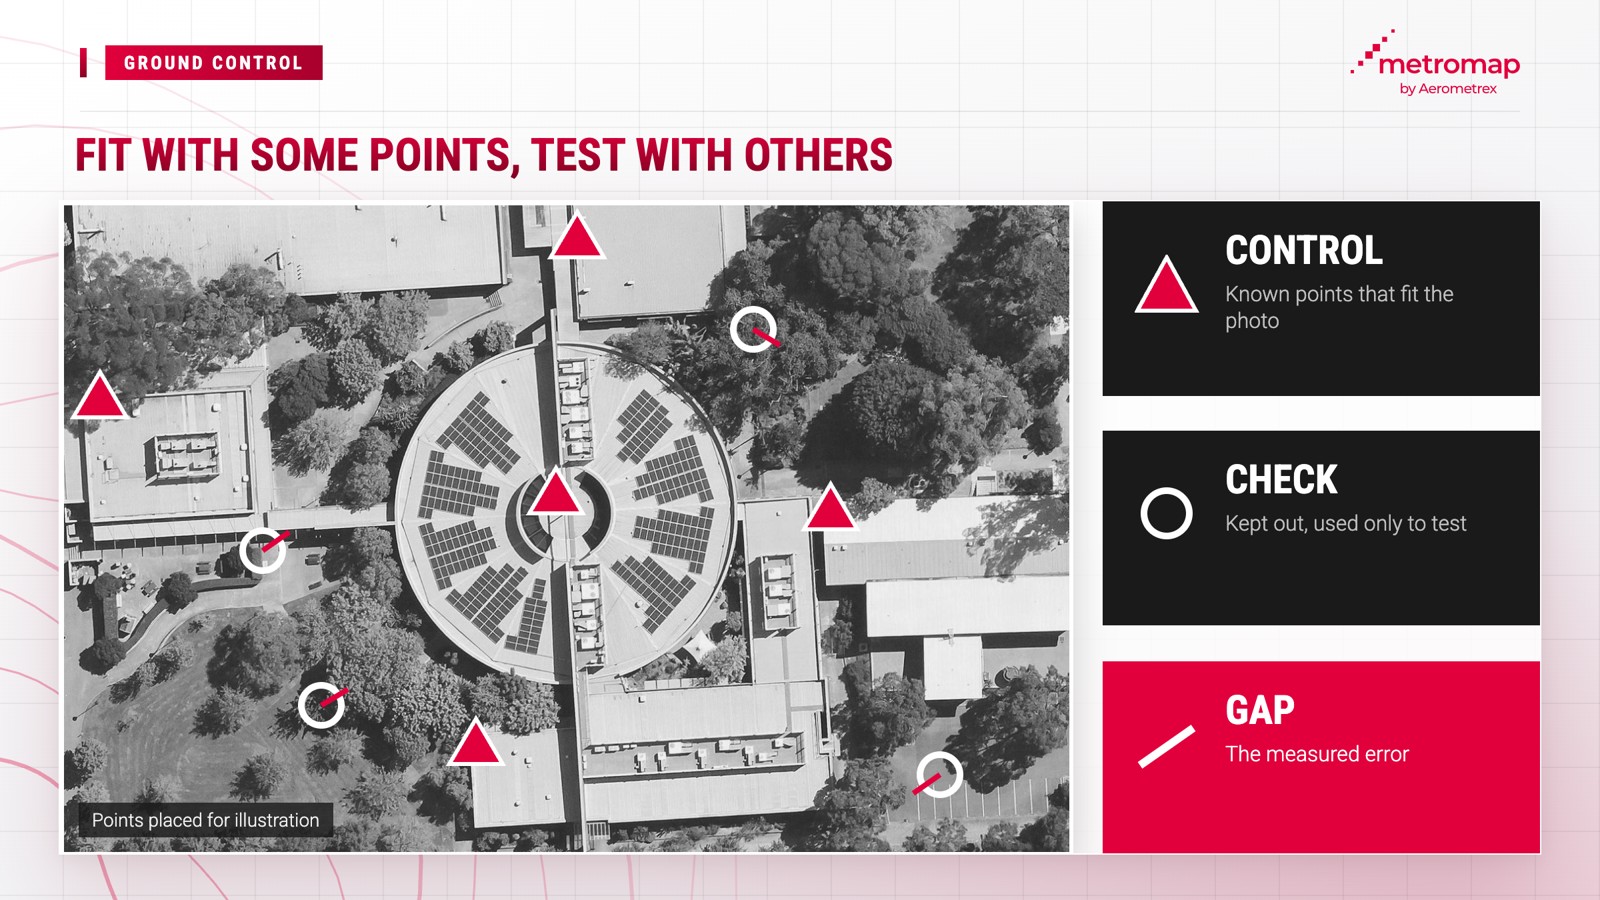
MetroMap imagery undergoes a series of mapping and data quality processes that transform raw aerial photographs into map imagery with an absolute horizontal positional accuracy of 3 pixels RMSE at 7 to 10 cm GSD. Absolute accuracy refers to the position of each point relative to its actual location on the ground, rather than its position relative to other features within the same image.
Because each capture is aligned with the same map grid, teams can repeat site measurements and identify changes over time. For example, a fence line measured in 2021 can be compared with imagery captured in the current year.
Aerial imagery provides substantially greater spatial detail than free satellite imagery due to its smaller pixel sizes. MetroMap offers a GSD of 7 to 10 cm, compared with the 10 m to 60 m resolution of free public satellite imagery used in Australia, according to Geoscience Australia. These measurements represent spatial resolution rather than positional accuracy, although MetroMap’s finer resolution provides sufficient detail for measuring individual land parcels.
According to Geoscience Australia’s guide to Digital Earth Australia, each Landsat pixel represents a ground area of 30 × 30 m, while Sentinel-2 pixels represent areas ranging from 10 × 10 m to 60 × 60 m, depending on the spectral band used.
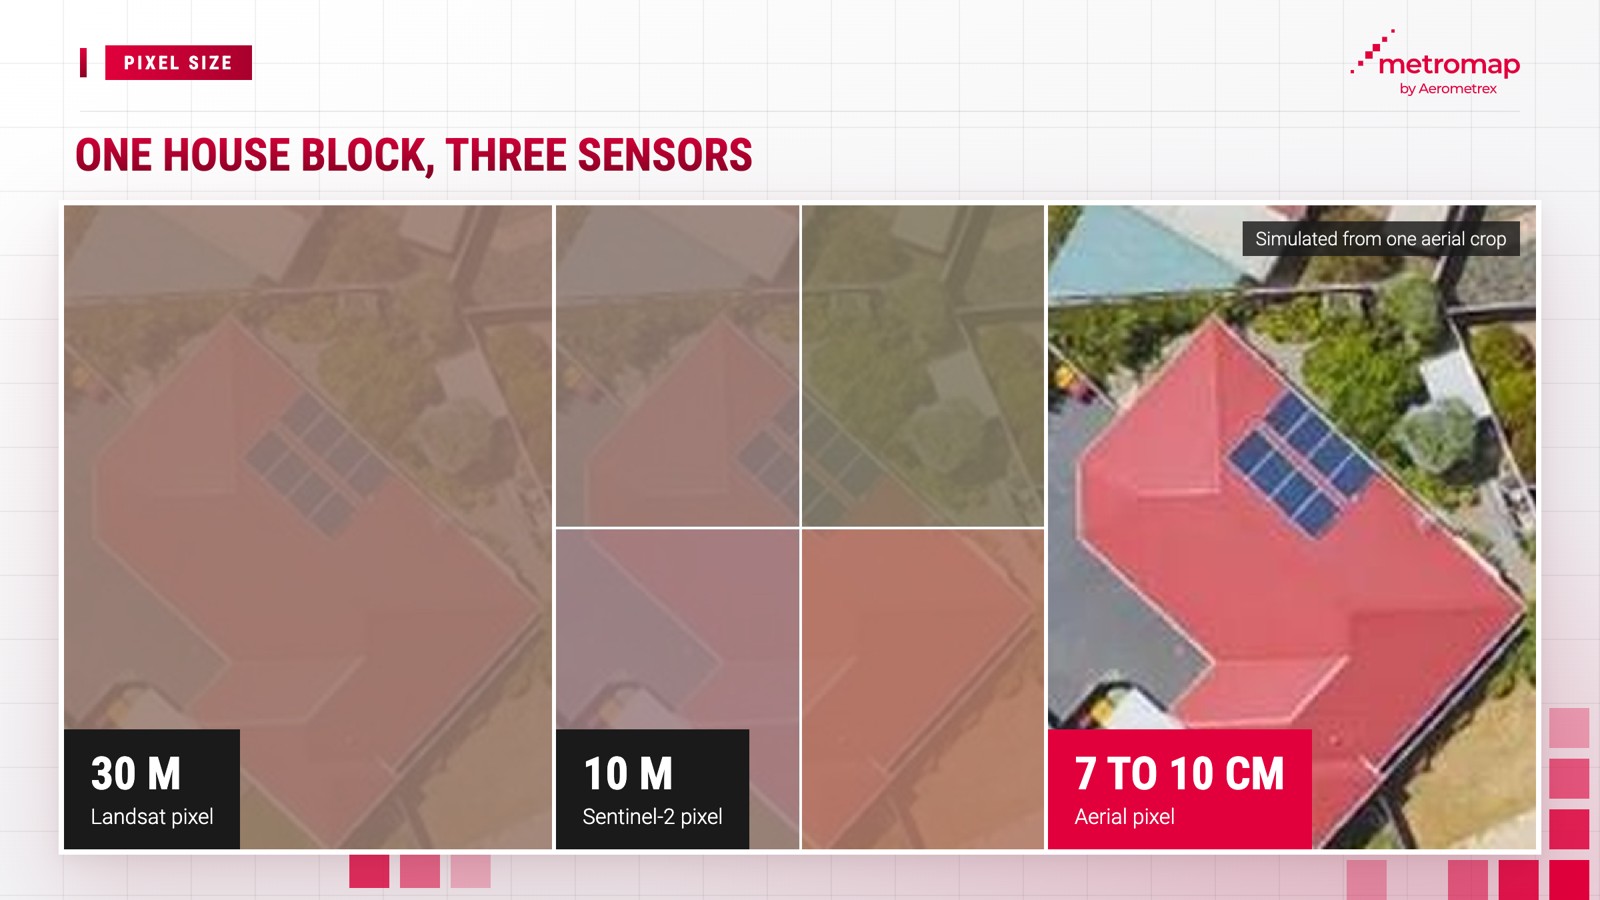
The table counts how many pixels of each source fit across one house block:
| One pixel covers | Pixels across a 20 m block | |
|---|---|---|
| Landsat | 30 m | Less than 1 |
| Sentinel-2 (sharpest band) | 10 m | 2 |
| MetroMap aerial | 7 to 10 cm | 200 to about 285 |
A 20 m house block spans under 1 Landsat pixel, 2 Sentinel-2 pixels and 200 to about 285 MetroMap pixels.
Satellite imagery offers significant advantages through repeated nationwide coverage, making it suitable for monitoring land cover and changes across regions. However, its spatial resolution is insufficient for examining finer features such as driveway edges, kerbs and rooflines.
Before conducting measurements using any imagery source, three factors should be assessed: pixel size, positional accuracy and the methodology used to validate that accuracy.
Each MetroMap capture includes a date, providing teams with a clear reference for when measurements were taken. MetroMap’s 2D aerial imagery provides tools for measuring distances and areas, while the Swipe tool enables side-by-side comparison of imagery from two different dates to identify changes over time.
Aerial imagery in Australia is captured by aircraft following predetermined flight paths using specialised mapping cameras. MetroMap imagery is collected by its partners, contractors and Aerometrex’s own aircraft. During the 2026 financial year, these flights captured 2.2 million frames for MetroMap, with each frame representing an individual aerial image.
Each imagery capture aims to meet MetroMap’s published capture plan, with capital cities typically captured 4 to 6 times per 12 months.
Each MetroMap imagery capture is scheduled to achieve suitable lighting conditions, with flight planning accounting for the time of day, solar angle and clear skies without cloud shadows. Following each flight, MetroMap combines the individual frames into a continuous, seamless map image.
Four key facts outline MetroMap’s ownership, imagery processing, geographic coverage and historical archive:
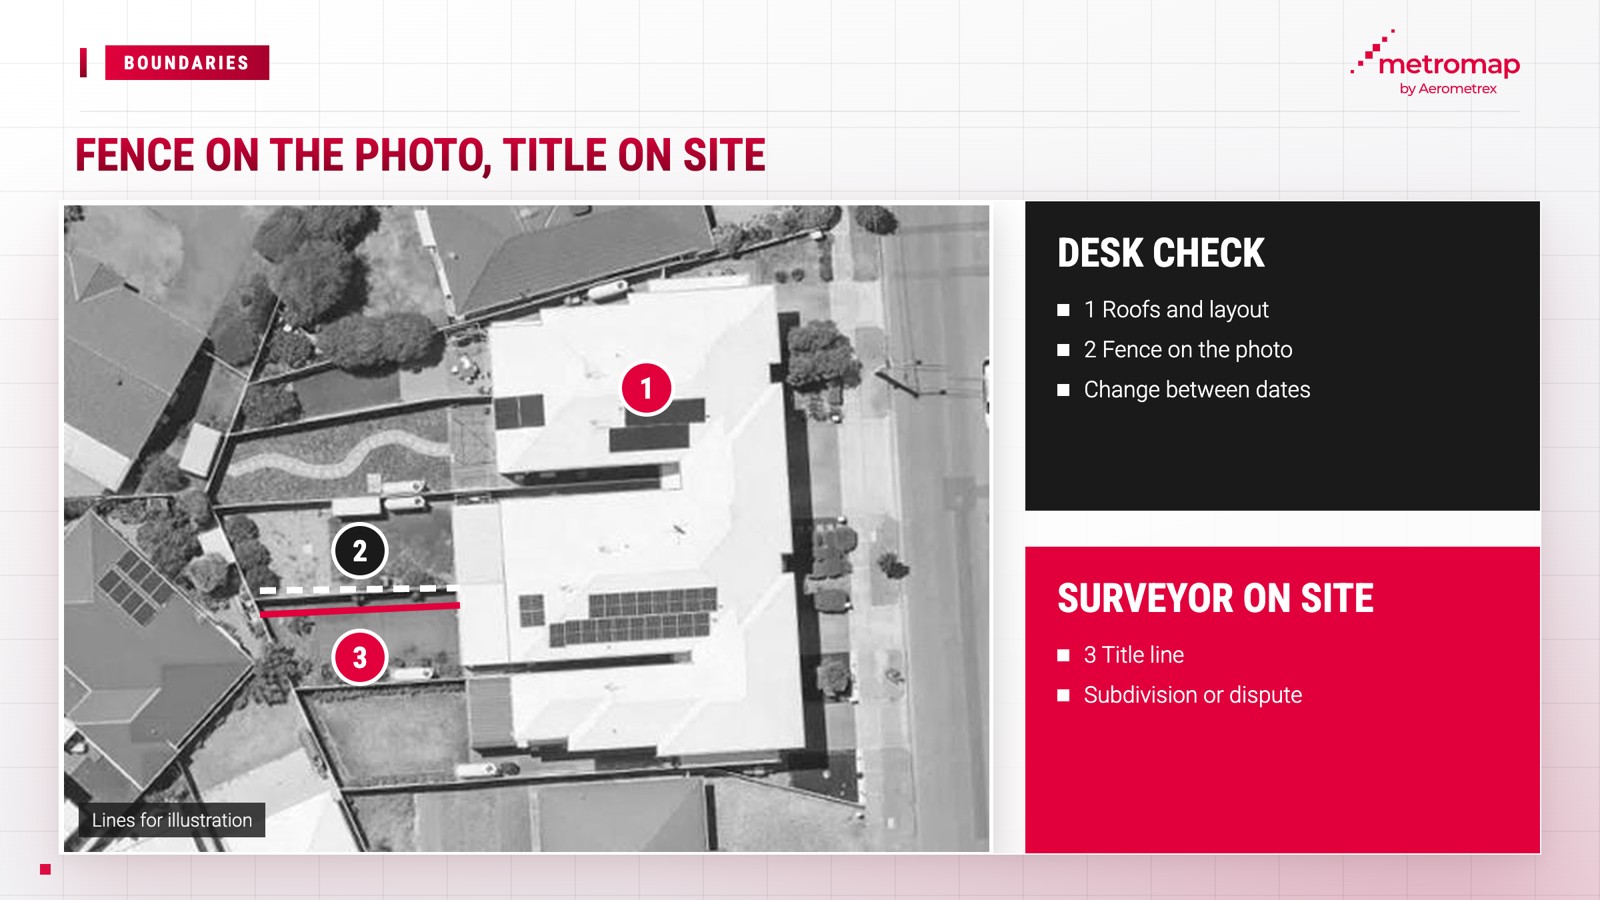
Aerial imagery cannot replace a registered boundary survey, as determining the legal position of a property boundary requires a registered surveyor. MetroMap imagery, with a typical positional error of 21 to 30 cm, can indicate potential fence misalignment but cannot establish the precise location of a legal property boundary.
This distinction is also reflected in the Tasmanian Government’s LISTmap guidance, which states that "only a land surveyor listed in the Register of Surveyors is authorised to survey the location of a title boundary in Tasmania".
The same guidance describes the boundary lines displayed on its map as "indicative only". Consequently, boundaries overlaid on aerial imagery are subject to potential inaccuracies in both the imagery and the underlying boundary map. Similarly, Legal Aid NSW advises that when neighbouring property owners cannot agree on a boundary, either party may engage a registered surveyor to determine the boundary line.
Aerial imagery supports preliminary site assessments and monitoring changes over time, while registered surveys establish legal property boundaries:
MetroMap imagery helps teams determine whether a survey is necessary and identify areas requiring further assessment, while a registered surveyor establishes the legally recognised boundary.
RMSE stands for Root Mean Square Error, the typical error over a set of test points: each test error is squared, the squares are averaged, and the square root is taken. MetroMap imagery has a horizontal accuracy of 3 pixels RMSE, about 21 to 30 cm at its 7 to 10 cm GSD.
The answer depends on the pixel size. MetroMap imagery has a GSD of 7 to 10 cm, so 3 pixels is about 21 to 30 cm on the ground.
MetroMap supports engineers with planning, site layouts and progress checks. A typical error of about 21 to 30 cm sets the limit, so a job with a tighter tolerance, such as set-out (marking exact building positions on site) or a final design survey, needs survey data.
MetroMap aerial imagery has much smaller pixels than free public satellite data: a Landsat pixel covers 30 x 30 m of ground, according to Geoscience Australia, while a MetroMap pixel covers 7 to 10 cm.
Partners and contractors fly for MetroMap, alongside Aerometrex's own aircraft, and together they captured 2.2 million frames (single images) for MetroMap in the 2026 financial year.
No. MetroMap imagery can show whether a fence looks out of line, but a legal boundary is set by a registered surveyor.
View the world from our eyes ! Here we share some exciting images from across MetroMap